Experience Tumblr like never before
Home Planet - Blog Posts
How Climate Change Showed Up in 2021
2021 was tied for the sixth-hottest year since modern record keeping began. We work together with the National Oceanic and Atmospheric Administration to track temperatures around the world and study how they change from year to year.

For decades, the overall global temperature has been increasing because of human activities. The last decade has been the warmest on record. Each individual year’s average temperature, however, can be affected by things like ocean circulation, volcanic eruptions, and specific weather events.
For instance, last year we saw the beginning of La Niña – a pattern of cooler waters in the Pacific – that was responsible for slightly cooling 2021’s average temperature. Still, last year continued a long-term trend of global warming.
Globally, Earth’s temperature in 2021 was nearly 2°F warmer than the late 19th Century, for the seventh year in a row.

The Record
Studying 142 Years
Since 1880, we can put together a consistent record of temperatures around the planet and see that it was much colder in the late-19th century. Before 1880, uncertainties in tracking global temperatures are larger. Temperatures have increased even faster since the 1970s, the result of increasing greenhouse gases in the atmosphere.
Tracking Millions of Individual Observations
Our scientists use millions of individual observations of data from more than 20,000 weather stations and Antarctic research stations, together with ship- and buoy-based observations of sea surface temperatures, to track global temperatures.

Reviewing Multiple Independent Records
Our global temperature record – GISTEMP – is one of a number of independent global temperature records, all of which show the same pattern of warming.

The Consequences
Everywhere Experiences Climate Change Differently
As Earth warms, temperature changes occur unevenly around the globe. The Arctic is currently warming about four times faster than the rest of the planet – a process called Arctic amplification. Similarly, urban areas tend to warm faster than rural areas, partly because building materials like asphalt, steel and concrete retain heat.

Droughts and Floods in Warmer Weather
More than 88% of the Western US experienced drought conditions in 2021. At the same time, communities in Western Europe saw two months’ worth of rain in 24 hours, breaking records and triggering flash floods. Because a hotter climate means more water can be carried in the atmosphere, areas like the Western US suffer drought from the increased 'thirstiness' of the atmosphere, while precipitation events can become more extreme as the amount of moisture in the atmosphere rises.

Sea Levels Continue to Rise
Melting ice raises sea levels around the world, as meltwater drains into the ocean. In addition, heat causes the ocean water to expand. From 1993 to today, global mean sea level has been rising around 3.4 millimeters per year. In 2021, sea level data from the recently launched NASA/ESA Sentinel-6 Michael Freilich mission became available to the public.

There is Hope
“This is not good news, but the fact that we are able to track this in real time and understand why it’s changing, and get people to notice why it’s changing and how we can change things to change the next trajectory, that gives me hope. Because we’re not in the dark here. We’re not the dinosaurs who are unaware the comet is coming. We can see the comet coming, and we can act.” – Dr. Gavin Schmidt, director of NASA GISS, where the global temperature record is calculated
Make sure to follow us on Tumblr for your regular dose of space!

NASA Spotlight: Earth Climate Scientist Dr. Yolanda Shea
Dr. Yolanda Shea is a climate scientist at NASA's Langley Research Center. She’s the project scientist for the CLARREO Pathfinder (CPF) mission, which is an instrument that will launch to the International Space Station to measure sunlight reflected from Earth. It will help us understand how much heat is being trapped by our planet’s atmosphere. Her mission is designed to help us get a clearer picture than we currently have of the Earth’s system and how it is changing
Yolanda took time from studying our home planet to answer questions about her life and career! Get to know this Earth scientist:
What inspired you to study climate science?
Starting in early middle school I became interested in the explanations behind the weather maps and satellite images shown on TV. I liked how the meteorologists talked about the temperature, moisture, and winds at different heights in the atmosphere, and then put that together to form the story of our weather forecasts. This made me want to learn more about Earth science, so I went to college to explore this interest more.
The summer after my junior year of college, I had an internship during which my first assignment was to work with a program that estimated ocean currents from satellite measurements. I was fascinated in the fact that scientists had discovered a way to map ocean currents from space!
Although I had learned about Earth remote sensing in my classes, this was my first taste of working with, and understanding the details of, how we could learn more about different aspects of the physical world from satellite measurements.
This led to my learning about other ways we can learn about Earth from space, and that includes rigorous climate monitoring, which is the area I work in now.

What does a day in your life look like?
Before I start my workday, I like to take a few minutes to eat breakfast, knit (I’m loving sock knitting right now!), and listen to a podcast or audio book. Each workday really looks different for me, but regardless, most days are a combination of quieter moments that I can use for individual work and more interactive times when I’m interfacing with colleagues and talking about project or science issues. Both types of work are fun in different ways, but I’m glad I have a mixture because all researchers need that combination of deep thinking to wrap our minds around complex problems and also time to tackle those problems with others and work on solving them together.
When do you feel most connected to Earth?
I’ve always loved sunsets. I find them peaceful and beautiful, and I love how each one is unique. They are also a beautiful reminder of the versatility of reflected light, which I study. Sitting for a moment to appreciate the beauty and calm I feel during a sunset helps me feel connected to Earth.

What will your mission – CLARREO Pathfinder – tell us about Earth?
CLARREO Pathfinder (CPF) includes an instrument that will take measurements from the International Space Station and will measure reflected sunlight from Earth. One of its goals is to demonstrate that it can take measurements with high enough accuracy so that, if we have such measurements over long periods of time, like several decades, we could detect changes in Earth’s climate system. The CPF instrument will do this with higher accuracy than previous satellite instruments we’ve designed, and these measurements can be used to improve the accuracy of other satellite instruments.
How, if at all, has your worldview changed as a result of your work in climate science?
The longer I work in climate science and learn from the data about how humans have impacted our planet, the more I appreciate the fragility of our one and only home, and the more I want to take care of it.

What advice would you give your younger self?
It’s ok to not have everything figured out at every step of your career journey. Work hard, do your best, and enjoy the journey as it unfolds. You’ll inevitably have some surprises along the way, and regardless of whether they are welcome or not, you’re guaranteed to learn something.
Do you have a favorite metaphor or analogy that you use to describe what you do, and its impact, to those outside of the scientific community?
I see jigsaw puzzles as a good illustration of how different members of a science community play a diverse set of roles to work through different problems. Each member is often working on their own image within the greater puzzle, and although it might take them years of work to see their part of the picture come together, each image in the greater puzzle is essential to completing the whole thing. During my career, I’ll work on a section of the puzzle, and I hope to connect my section to others nearby, but we may not finish the whole puzzle. That’s ok, however, because we’ll hand over the work that we’ve accomplished to the next generation of scientists, and they will keep working to bring the picture to light. This is how I try to think about my role in climate science – I hope to contribute to the field in some way; the best thing about what I have done and what I will do, is that someone else will be able to build on my work and keep helping humanity come to a better understanding of our Earth system.
What is a course that you think should be part of required school curriculum?
Time and project management skills – I think students tend to learn these skills more organically from their parents and teachers, but in my experience I stumbled along and learned these skills through trial and error. To successfully balance all the different projects that I support now, I have to be organized and disciplined, and I need to have clear plans mapped out, so I have some idea of what’s coming and where my attention needs to be focused.
Another course not specifically related to my field is personal financial management. I was interested in personal finance, and that helped me to seek out information (mainly through various blogs) about how to be responsible with my home finances. There is a lot of information out there, but making sure that students have a solid foundation and know what questions to ask early on will set them to for success (and hopefully fewer mistakes) later on.

What’s the most unexpected time or place that your expertise in climate science and/or algorithms came in handy?
I think an interesting part of being an atmospheric scientist and a known sky-watcher is that I get to notice beautiful moments in the sky. I remember being on a trip with friends and I looked up (as I usually do), and I was gifted with a gorgeous sundog and halo arc. It was such a beautiful moment, and because I noticed it, my friends got to enjoy it too.

Can you share a photo or image from a memorable NASA project you’ve worked on, and tell us a little bit about why the project stood out to you?
I absolutely loved being on the PBS Kids TV Show, SciGirls for their episode SkyGirls! This featured a NASA program called Students’ Clouds Observations On-Line (S’COOL). It was a citizen science program where students from around the globe could take observations of clouds from the ground that coincided with satellite overpasses, and the intention was to help scientists validate (or check) the accuracy of the code they use to detect clouds from satellite measurements. I grew up watching educational programming from PBS, so it was an honor to be a science mentor on a TV show that I knew would reach children across the nation who might be interested in different STEM fields. In this photo, the three young women I worked with on the show and I are talking about the different types of clouds.
To stay up to date on Yolanda's mission and everything going on in NASA Earth science, be sure to follow NASA Earth on Twitter and Facebook.
🌎 If you're looking for Earth Day plans, we have live events, Q&As, scavenger hunts and more going on through April 24. Get the details and register for our events HERE.
Make sure to follow us on Tumblr for your regular dose of space: http://nasa.tumblr.com.
Stars, Sea, and Smoke from the ISS: Tournament Earth 2021
We started Tournament Earth with 32 photos taken by astronauts from the Interantional Space Station and now we are down to 8. All of the #1 seeds are gone. Two #8 seeds are dominating their groups. Who will win? Let's take a closer look at the competitors still in the game. Then remember to vote for your favorites. The champion will be announced on April 13, 2021.
Stars in Motion vs. Cleveland Volcano
This matchup pits smoke against stars, but both have interesting stories.

The International Space Station (ISS) is constantly in motion. For astronaut photographers on board, that motion has consequences. For one, it makes it challenging to take photos. The same motion makes it possible to shoot spectacular photos like the one above. The image is compiled from a series of photographs taken by astronaut Don Pettit while he was onboard the ISS in April 2012. This composite was made from more than 72 individual long-exposure photographs taken over several minutes as the ISS traveled over the Caribbean Sea, across South America, and over the South Atlantic Ocean.

Astronaut Jeff Williams was the first to witness activity at the Cleveland Volcano on May 3, 2006. The Cleveland Volcano is one of the most active in the Aleutian Islands, which extend west-southwest from the Alaska mainland. It is a stratovolcano composed of alternating layers of hardened lava, compacted volcanic ash, and volcanic rocks. The event proved to be short-lived; two hours later, the plume had completely detached from the volcano. The ash cloud height could have been as high as 6,000 meters (20,000 feet) above sea level.
Stargazing from the ISS vs. Cruising Past the Aurora Borealis
This is the most stellar matchup of the tournament, literally. Two beloved star pictures face off in what will be one of the most difficult choices of the tournament.

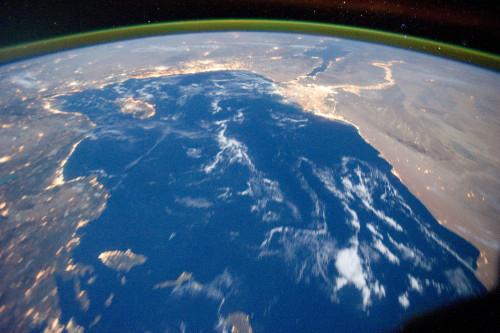
An astronaut took this broad, short-lens photograph of Earth’s night lights while looking out over the remote reaches of the central equatorial Pacific Ocean. The ISS was passing over the island nation of Kiribati at the time, about 2600 kilometers (1,600 miles) south of Hawaii. Scientists identified the pattern of stars in the photo as our Milky Way galaxy (looking toward its center). The dark patches are dense dust clouds in an inner spiral arm of our galaxy; such clouds can block our view of stars toward the center. The curvature of the Earth crosses the center of the image and is illuminated by a variety of airglow layers in orange, green, and red.

Commonly known as the northern lights, these colorful ribbons of light appear to dance in the sky over the planet’s high latitudes, attracting sky chasers and photographers. Astronaut Randy “Komrade” Bresnik shot this photograph on September 15, 2017, as the space station passed over Ontario, Canada. Curtains of green—the most familiar color of auroras—dominate the light show, with hints of purple and red.
Rolling Through the Appalachians vs. Castellanus Cloud Tower

The Susquehanna River cuts through the folds of the Valley-and-Ridge province of the Appalachian Mountains in this photograph taken from the International Space Station by astronaut Christina Koch. The Valley-and-Ridge province is a section of the larger Appalachian Mountain Belt between the Appalachian Plateau and the Blue Ridge physiographic provinces. The northeast-southwest trending ridges are composed of Early Paleozoic sedimentary rocks. The valleys between them were made of softer rocks (limestone and shales) that were more susceptible to erosion; they are now occupied by farms.

An astronaut aboard the International Space Station took this photograph of a massive vertical cloud formation—known to meteorologists as cumulus castellanus—above Andros Island. The cloud name castellanus comes from the similarity to the crenellated towers or turrets of medieval castles. These clouds develop due to strong vertical air movement typically associated with thunderstorms.
Lake Van, Turkey vs. Typhoon Maysak from the Space Station

While orbiting on the International Space Station, astronaut Kate Rubins shot this photograph of part of Lake Van in Turkey, the largest soda or alkaline lake on Earth. Generally, soda lakes are distinguished by high concentrations of carbonate species. Lake Van is an endorheic lake—it has no outlet, so its water disappears by evaporation—with a pH of 10 and high salinity levels.

This photograph of super typhoon Maysak was taken by European Space Agency astronaut Samantha Cristoforetti as the International Space Station passed near the storm on March 31, 2015. The category 4 typhoon was headed for a possible landfall in the Philippines by the end of the week. It was unusual for the western Pacific to see such a strong storm so early in the year.
See all of the images and vote HERE. Follow @NASAEarth on social media for updates.
Make sure to follow us on Tumblr for your regular dose of space: http://nasa.tumblr.com
One Hot Year after Another
Globally, 2020 was the hottest year on record, effectively tying 2016, the previous record. Overall, Earth’s average temperature has risen more than 2 degrees Fahrenheit since the 1880s.

Temperatures are increasing due to human activities, specifically emissions of greenhouse gases, like carbon dioxide and methane.
Heat and the energy it carries are what drive our planet: winds, weather, droughts, floods, and more are expressions of heat. The right amount of heat is even one of the things that makes life on Earth possible. But too much heat is changing the way our planet’s systems act.
My World’s on Fire
Higher temperatures drive longer, more intense fire seasons. As rain and snowfall patterns change, some regions are getting drier and more vulnerable to damage, setting the stage for more fires.

2020 saw several record-breaking fires, both in Australia in the beginning of the year, and in the western U.S. through northern summer and fall. Smoke from fires in both regions reached so high into the atmosphere that it formed clouds and continues to travel around the globe today.

In the Siberian Arctic, unusually high temperatures helped drive at least 19 fires in the region. More than half of them were burning peat soil -- decomposed organic materials -- that stores a lot of carbon. Peat fires release vast amounts of carbon into the atmosphere, potentially leading to even more warming.

The Water’s Getting Warm
It wasn’t just fire seasons setting records. 2020 had more named tropical storms in the Atlantic and more storms making landfall in the U.S. than any hurricane season on record.

Hurricanes rely on warm ocean water as fuel, and this year, the Atlantic provided. 30 named storms weren’t the only things that made this year’s hurricane season notable.

Storms like Eta, Delta, and Iota quickly changed from smaller, weaker tropical storms into more destructive hurricanes. This rapid intensification is complicated, but it’s likely that warmer, more humid weather -- a result of climate change -- helps drive it.

The Ice Is Getting Thin
Add enough heat, and even the biggest chunk of ice will melt. That’s true whether we’re talking about the ice cubes in your glass or the vast sheets of ice at our planet’s poles. Right now, the Arctic region is warming about three times faster than the rest of our planet, which has some major effects both locally and globally.

This year, Arctic sea ice hit a near-record low. Sea ice is actually made of frozen ocean water, and it grows and thaws with the seasons, typically reaching an annual minimum extent in September.

Warmer ocean water led to more ice melting this year, and 2020’s annual minimum extent continued a long trend of shrinking Arctic sea ice extent.
A Long Trend
We study Earth and how it’s changing from the ground, the sky, and space. Using data from sensors all around the planet, we calculate the global average temperature, working with our partners at NOAA.
Many other organizations also track global temperature using their own instruments and methods, and they all match remarkably well. The last seven years were the hottest seven years on record. Earth is getting warmer.

We also study the effects of increasing temperatures, like the melting sea ice and longer fire seasons mentioned above. Additionally, we can study the cause of climate change from space, with a bird’s eye view of increasing carbon in the atmosphere.

The planet is changing because of human activities. We’re working together with other agencies to monitor changes and understand what this means for people in the future.
Make sure to follow us on Tumblr for your regular dose of space: http://nasa.tumblr.com.
More than Just Dust in the Wind

From space, we can see a swirling brown mass making its way across the Atlantic – dust from the Sahara Desert – the largest hot desert in the world. It’s a normal phenomenon. Every year, winds carry millions of tons of dust from North Africa, usually during spring and summer in the Northern Hemisphere.

June 2020 has seen a massive plume of dust crossing the ocean. It’s so large it’s visible from one million miles away in space.

Dust clouds this large can affect air quality in regions where the dust arrives. The particles can also scatter the Sun’s light, making sunrises and sunsets more vibrant.

Dust particles in the air are also known as aerosols. We can measure aerosols, including dust, sea salt and smoke, from satellites and also use computer models to study how they move with the wind.

Following the transport of dust from space shows us how one of the driest places on Earth plays a role in fertilizing the Amazon rainforest. There are minerals in Saharan dust, like phosphorous, that exist in commercial fertilizers, helping seed the rainforest.
Make sure to follow us on Tumblr for your regular dose of space: http://nasa.tumblr.com
Earth’s Land Ice by the Numbers
“At a glacial pace” used to mean moving so slowly the movement is almost imperceptible. Lately though, glaciers are moving faster. Ice on land is melting and flowing, sending water to the oceans, where it raises sea levels.

In 2018, we launched the Ice, Cloud and Land Elevation Satellite-2 (ICESat-2) to continue a global record of ice elevation. Now, the results are in. Using millions of measurements from a laser in space and quite a bit of math, researchers have confirmed that Earth is rapidly losing ice.

16 Years
ICESat-2 was a follow-up mission to the original ICESat, which launched in 2003 and took measurements until 2009. Comparing the two records tells us how much ice sheets have melted over 16 years.

½ Inch
During those 16 years, melting ice from Antarctica and Greenland was responsible for just over a half-inch of sea level rise. When ice on land melts, it eventually finds its way to the ocean. The rapid melt at the poles is no exception.

400,000 Olympic Swimming Pools
One gigaton of ice holds enough water to fill 400,000 Olympic swimming pools. It’s also enough ice to cover Central Park in New York in more than 1,000 feet of ice.

200 Gigatons
Between 2003 and 2019, Greenland lost 200 gigatons of ice per year. That’s 80 million Olympic swimming pools reaching the ocean every year, just from Greenland alone.

118 Gigatons
During the same time period, Antarctica lost 118 gigatons of ice per year. That’s another 47 million Olympic swimming pools every year. While there has been some elevation gain in the continent’s center from increased snowfall, it’s nowhere near enough to make up for how much ice is lost to the sea from coastal glaciers.

10,000 Pulses
ICESat-2 sends out 10,000 pulses of laser light a second down to Earth’s surface and times how long it takes them to return to the satellite, down to a billionth of a second. That’s how we get such precise measurements of height and changing elevation.

These numbers confirm what scientists have been finding in most previous studies and continue a long record of data showing how Earth’s polar ice is melting. ICESat-2 is a key tool in our toolbox to track how our planet is changing.
Make sure to follow us on Tumblr for your regular dose of space: http://nasa.tumblr.com.
Game Time: Final Voting for Tournament Earth
The moment has arrived- it's time to decide the NASA Earth Observatory's all-time best image. After four grueling rounds of voting, two contenders remain: Ocean Sand, Bahamas (#5 seed) versus Raikoke Erupts (#6 seed).

The road to the finals has been full of surprises. All top seeds have been knocked out. In one semifinal, Ocean Sand garnered 50.6 percent of the votes to squeak out a win over the overall favorite, Twin Blue Marbles. In the other matchup, Raikoke Erupts trounced Where the Dunes End, 66.5 to 33.5 percent.
Now you have to pick a champion. Will it be a gorgeous, artistic image from the very early years of Earth Observatory or stunning natural-color views of an explosive event from 2019? Which image will you crown as the best in the EO archives: Ocean Sand, Bahamas or Raikoke Erupts? Voting ends on April 28 at 9 a.m. U.S. Eastern Time.
Thank you for helping us celebrate Earth Observatory’s 20th anniversary and the 50th anniversary of Earth Day!
Vote here: https://earthobservatory.nasa.gov/tournament-earth
Make sure to follow us on Tumblr for your regular dose of space: http://nasa.tumblr.com.
How is it like to be a NASA Earth Scientist? What Subjects are you required to excel at to become one? Were you really good in your studies, when you were a young teenager?
Are there any parts of the Earth still left unexplored?
Is Earth your favorite planet? Why or why not?
Earth Day at Home with NASA
When you think about Earth Day, you might think about planting trees or picking up garbage. But right now, as a lot of us are staying inside to stay safe, we’ve got you covered for Earth Day at Home with ways to appreciate our beautiful home planet from your couch.
Want to help our researchers map coral in the ocean?
Our new NeMo-Net app lets you do that while playing a game!

What about virtually exploring our planet?
Worldview lets you choose any location on Earth and see it the way our satellites do – in natural color, lit by electric lights at night, or in infrared, highlighting fires around the globe.

On April 22 -- Earth Day -- we’ll have a host of activities you can participate in. Scientists will share their research from their own homes, including messages from astronauts living on the International Space Station! Hear stories from a trip to Earth’s most remote location: Antarctica, including what happens when the chocolate goes missing on a weeks-long excursion. We’ll even have a new episode of NASA Science Live sharing some of what we’re doing to make our work more sustainable.

We’ll be sharing Earth Day from our homes with #EarthDayAtHome on Twitter, Instagram, Facebook and with a Tumblr Answer Time right here! Follow along, and participate, as we share our love for our home planet with you.
Make sure to follow us on Tumblr for your regular dose of space: http://nasa.tumblr.com.

Participate in the 50th anniversary of Earth Day by asking our experts anything about NASA’s role in Earth Science!
This year marks the 50th anniversary of Earth Day, and to commemorate the big day we’re bringing you exclusive access our Acting Director of Earth Sciences, Sandra Cauffman, and Associate Administrator for the Science Mission Directorate, Dr. Thomas Zurbuchen! They will be teaming up to take your questions in an Answer Time session on Earth Day, April 22, from 12-1pm EDT here on NASA’s Tumblr! Make sure to ask your question now by visiting http://nasa.tumblr.com/ask!
Our investment in space – both the unique Earth science we conduct from orbit and the technology we’ve developed by living in space and exploring our solar system and universe – is returning benefits every day to people around the world, particularly those who are working on environmental issues. From documenting Earth’s changing climate to creating green technologies to save energy and natural resources, we’re working to help us all live more sustainably on our home planet and adapt to natural and human-caused changes.

NASA Earth Science Fun Facts!
From space we study: dust storms, volcanoes, flooding, coral reefs, night lights, wildfires, urban growth, food production, mosquito tracking and other human health issues, precipitation across the world, hurricanes and typhoons, soil moisture, land and sea ice, and changes to the land and sea surfaces.
From airborne research planes we track: changes in polar ice, glaciers, sea level rise, cloud formation, storms, sea level rise and Earth’s changing landscape.
Our Earth science focus areas include: Atmospheric Composition, Weather and Atmospheric Dynamics, Climate Variability and Change, Water and Energy Cycle, Carbon Cycle and Ecosystems, Earth Surface and Interior
Keep up to date with all our Earth Science missions and research by following NASA Earth on Twitter, Facebook and Instagram.
Make sure to follow us on Tumblr for your regular dose of space: http://nasa.tumblr.com.
Choose Your Champion: Tournament Earth 2020
Tournament Earth is here! We want YOU to help us choose our best Earth image.

Since 1999, NASA Earth Observatory has published 16,000+ images. To celebrate our 20th anniversary and the 50th anniversary of Earth Day, we want you to pick our all-time best image. Each week from March 23 to April 28, you can vote for your favorite images. Readers will narrow the field from 32 nominees down to one champion in a five-round knockout-style tournament.
The nominees are separated into four groups: Past Winners, Home Planet, Land & Ice, and Sea & Sky.
Past Winners

No, that is not an animation of the death star orbiting Earth. It is the winner of Tournament Earth in 2016– the Dark Side and the Bright Side. The image shows the fully illuminated far side of the Moon that is not visible from Earth. Other contenders in this category are a picture of a volcanic eruption plume, sands and seas in the Bahamas, and lightning seen from the Space Station.
Home Planet

This picture of the Twin Blue Marbles is the number one seed in our "Home Planet" category, but that doesn't mean it's going to take home the crown. It has stiff competition from the iconic photo of Earth rising to an epic total solar eclipse to our Earth at night.

Land & Ice

Are you a land lover or ice lover? If you don't know, you might found out by browsing the beautiful imagery in this category. Vote on scenes from the partially frozen North Caspian Sea (above) to lava flowing in Iceland between the Bardarbunga and Askja volcanoes (below).

Sea & Sky

Hurricanes, lightning, and volcanic explosions are just a few of the amazing captures from NASA satellites and astronauts in this category.
The model-based visual above shows an expansive view of the mishmash of particles that dance and swirl through the atmosphere. It shows tropical cyclones, dust storms, and fires spreading tiny particles throughout the atmosphere during one day in August 2018.

Our satellites also capture the fine mixing of particles and churning of tides in our rivers. The image above shows dissolved organic matter from forests and wetlands that stained the water dark brown near Rupert Bay. A similar process darkens tea.
Learn more about Tournament Earth in the video below.
See all of the images and vote now HERE.
Make sure to follow us on Tumblr for your regular dose of space: http://nasa.tumblr.com.
“Only in the darkness can you see the stars.” —Martin Luther King, Jr. Pause for a moment and take in the vastness and beauty of our home planet captured from the vantage point of space. On this spaceship we call Earth, we are all in this together. 💙
Make sure to follow us on Tumblr for your regular dose of space: http://nasa.tumblr.com.
Satellite Data in Ag-tion: From Space to Your Plate
As Earth’s climate changes, some places are drying out and others are getting wetter, including the land that produces the food we eat. Farmers have to figure out how to adapt to changing climate conditions.

Our fleet of satellites has been watching over Earth for more than half a century. Some, like our joint Landsat mission with the U.S. Geological Survey (USGS), collect valuable data about the crops that make up our food supply and the water it takes to grow them.

Combining this wealth of satellite data with observations on the ground allows us to track how crop production changes over the years.
For example, this map shows how croplands have changed over the years to feed a growing population. The Agriculture Department (USDA) has used Landsat data since 2008 to track crops growing in the continental United States.

Agricultural scientists can even focus in on data for individual crops like corn, wheat and soybeans. They can look closely at regional crops, like citrus, that grow in only a few areas.

This nationwide view — provided by Landsat satellites orbiting 438 miles above Earth — is important to track the nation’s food supply. But with data from other satellites, like our ECOSTRESS instrument and ESA’s (the European Space Agency) Sentinel-2, agricultural scientists can monitor how healthy crops are in real time and predict when they’ll be ready to harvest.
In this false-color image of California farmland, red areas peak early in the season, whereas blue areas peak late. This information helps farmers watch over the plants in their fields, predict when they’ll be ready to harvest, and maximize crop production.

But while growing more and more crops sounds good, there can be challenges, like water. Especially when there’s not enough of it.
During California’s recent drought, just over 1 million acres of fertile farmland (shown in green) were fallow, or unused (red) in 2015. That’s nearly double the number of unused fields in 2011, the last year with normal rainfall before the drought.

Irrigating acres and acres of farmland takes lots of water. With remote sensing, scientists can track how irrigation fluctuates with climate change, new water management policies, or new technologies. Research like this helps farmers grow the most crops with the least amount of water.

As our climate changes, it’s more important than ever for farmers to have the knowledge they need to grow crops in a warming world. The data collected by our Earth-observing satellites help farmers learn about the planet that sustains us — and make better decisions about how to cultivate it.
Make sure to follow us on Tumblr for your regular dose of space: http://nasa.tumblr.com
What can you see from the space station? Can you see stars, the moon and sun, and Earth weather like lightening storms?
can you describe how earth looks like from space?
2019 Temperature By the Numbers
The Year
2nd Hottest
2019 was the second-hottest year since modern record keeping began. NASA and the National Oceanic and Atmospheric Administration work together to track temperatures around the world and study how they change from year to year. For decades, the overall global temperature has been increasing.

Over the long term, world temperatures are warming, but each individual year is affected by things like El Niño ocean patterns and specific weather events.
The global temperature is an average, so not every place on Earth had its second-warmest year. For instance, the continental U.S. had a cold October, but Alaska set records for high temperatures. The U.S. was still warmer than average over the year.
Globally, Earth’s temperature in 2019 was more than 2°F warmer than the late 19th Century.
The Record
140 years
Since 1880, we can put together a consistent record of temperatures around the planet and see that it was much colder in the late-19th century. Before 1880, uncertainties in tracking global temperatures are larger. Temperatures have increased even faster since the 1970s, the result of increasing greenhouse gases in the atmosphere.

10 years
The last decade was the hottest decade on record.

20,000 Individual Observations
Scientists from NASA use data from more than 20,000 weather stations and Antarctic research stations, together with ship- and buoy-based observations of sea surface temperatures to track global temperatures.

The Consequences
90%
As Earth warms, polar ice is melting at an accelerated rate. The Arctic is warming even faster than the rest of the planet. This northern summer, 90% of the surface of the Greenland Ice Sheet melted.

8 inches
Melting ice raises sea levels around the world. While ice melts into the ocean, heat also causes the water to expand. Since 1880, sea levels globally have risen approximately 8 inches, although regional rates of sea level rise can be even higher.

100+ fires
As temperatures increase, fire seasons burn hotter and longer. During June and July 2019, more than 100 long-lived and intense wildfires burned north of the Arctic circle. This year also saw intense, record-setting fires in Australia.


46% increase in CO2 levels
This decades-long warming trend is the result of increasing greenhouse gases in the atmosphere, released by human activities.

Make sure to follow us on Tumblr for your regular dose of space: http://nasa.tumblr.com
That’s a wrap folks! Gucci is signing off. Thank you for all the amazing questions. Didn’t get your question answered? No worries! We’re coming to you live next week in our second Answer Time of 2020, featuring NASA Astronaut Nick Hague. Submit your questions now here: https://nasa.tumblr.com/ask

Hi Mr Neeley, thank you for answering questions! I’ve got two things I want to know- how does the cockpit differ form a normal one? Are there special instruments in there? And do you get tired in long flights? What sort of system is in place to make sure you get sufficient rest if you are flying 12+ hours?
When you're finally up out of the air, high enough to see the Earth, what is it like to see our home planet from above for the first time?
What from your job have you learned that you think everyone on Earth should know?
who was your biggest inspiration, if any, and what events led you to follow this career choice?
How does flying feel?
What made you want to become a pilot for NASA? What’s your favorite part of this job?
What does it feel like to be up there and look down at the Earth? I've always imagined it would send me into a moment where I feel so small compared to the expanse and beauty of Earth.

Wonder what it’s like to fly for NASA Earth science expeditions? Ask our research pilot anything!
This January, we’re kicking off five new airborne Earth science expeditions aimed at studying our home planet from the land, sea and air. Here’s your chance to hear what it’s like from the cockpit!
Research pilot Dean “Gucci” Neeley will be taking your questions in an Answer Time session on Friday, January 10 from 12-1pm ET here on NASA’s Tumblr! Find out what it’s like to fly research aircraft that use the vantage point of space to increase our understanding of Earth, improve lives and safeguard our future! Make sure to ask your question now by visiting http://nasa.tumblr.com/ask!
Dean Neeley, retired U.S. Air Force officer and pilot, joined our Armstrong Flight Research Center in 2012 as a research pilot. Neeley flies a diverse array of highly modified airborne science, research and mission support aircraft such as the single-seat Lockheed ER-2 high-altitude science jet. The ER-2 collects information about Earth resources, celestial observations, atmospheric chemistry and dynamics and oceanic processes. Neeley has also flown the Gulfstream G-II mission support aircraft, which explores environmentally friendly aircraft concepts, the Stratospheric Observatory for Infrared Astronomy (SOFIA), which observes the solar system and beyond at mid- and far-infrared wavelengths, and the C-20A (G-III) science platform aircraft, which carries our Jet Propulsion Laboratory's synthetic aperture radar.
Dean Neeley Fun Facts
Dean’s call sign Gucci came from flying KC-10 “Gucci Boys” before being hired to fly U-2 aircraft. Some say he spends too much time/money on his hair, clothes, cars. 😂
He played drums in two rock bands in the 80s and 90s; Agent Orange and the Defoliants; The Mod Sky Gods.
He spent his years in the Air Force as a reconnaissance squadron commander, wing chief of safety, stealth fighter squadron director and bomber in multiple worldwide aerial combat campaigns.
Dean holds a Bachelor of Science in Aerospace Engineering and a Master of Aeronautical Science degree.
Make sure to follow us on Tumblr for your regular dose of space: http://nasa.tumblr.com.
🔎 Lava Lake Discovery
🌋 Raikoke Volcano Eruption
🔥 Uptick in Amazon Fire Activity
2019 brought many memorable events on Planet Earth, and NASA satellites and astronauts captured a lot of the action! From new discoveries to tracking natural events and capturing amazing scenery, here are a few highlights from around the globe.
Read more about the images in this video, here.
It’s a Bird! It’s a Plane! It’s NASA’s Five Newest Airborne Campaigns!
We’re not just doing research in space! From the land, the sea and the sky, we study our planet up close. Right now, we’re gearing up for our newest round of Earth Expeditions, using planes, boats and instruments on the ground to study Earth and how it’s changing.

The newest round of campaigns takes place all across the United States – from Virginia to Louisiana to Kansas to California.

The five newest missions will combine measurements from the ground, the sea, air and space to investigate storms, sea level rise and processes in the atmosphere and ocean.
Let’s meet the newest Earth science missions:
1. IMPACTS
The Investigation of Microphysics and Precipitation for Atlantic Coast-Threatening Snowstorms will start from Wallops Flight Facility in Virginia to understand how bands of snow form during winter storms in the East Coast. This research will help us better forecast intense snowfall during extreme winter weather.

2. ACTIVATE
Flying out of Langley Research Center, the Aerosol Cloud Meteorology Interactions over the Western Atlantic Experiment is studying how specific types of clouds over oceans affect Earth’s energy balance and water cycle. The energy balance is the exchange of heat and light from the Sun entering Earth’s atmosphere vs. what escapes back into space.

3. Delta-X
Farther south, Delta-X is flying three planes around the Mississippi River Delta to study how land is deposited and maintained by natural processes. Studying these processes can help us understand what will happen as sea levels continue to rise.

4. DCOTSS
Heading out to the Midwest this summer, the Dynamics and Chemistry of the Summer Stratosphere mission will study how thunderstorms can carry pollutants from high in the atmosphere deep into the lower stratosphere, where they can affect ozone levels.

5. S-MODE
About 200 miles off the coast of San Francisco, the Sub-Mesoscale Ocean Dynamics Experiment is using ships, planes and gliders to study the impact that ocean eddies have on how heat moves between the ocean and the atmosphere.

These missions are kicking off in January, so stay tuned for our updates from the field! You can follow along with NASA Expeditions on Twitter and Facebook.

Make sure to follow us on Tumblr for your regular dose of space: http://nasa.tumblr.com.
The Island Named After a Satellite
It is so small that you cannot see it on Google maps. It measures 25 by 45 meters (27 by 49 yards), about half the size of a football field. This barren bit of rock off the coast of Canada also has an unusual namesake: the Landsat 1 satellite. The small size is actually what made the island notable in 1973, when it was initially discovered. Well, that, and the polar bear trying to eat one of the surveyors.
Betty Fleming, a researcher with the Topographic Survey of Canada, was hunting for uncharted islands and rocks amidst data from the new Landsat 1 satellite. She was particularly interested in the new satellite's ability to find small features. Working with the Canadian Hydrographic Service, Fleming scanned images of the Labrador coast, an area that was poorly charted. About 20 kilometers (12 miles) offshore, the satellite detected a tiny, rocky island. Surveyors were sent to verify the existence of the island and encountered a hungry polar bear on the island. The surveyor quickly retreated. Eventually, the island became known as “Landsat Island,” after the satellite that discovered it. Watch the video to learn more about Betty Fleming and how Landsat Island was discovered by satellite and ground surveyors.
For more details about Landsat Island, read the full stories here:
The Island Named After a Satellite
The Unsung Woman Who Discovered an Unknown Island
Make sure to follow us on Tumblr for your regular dose of space: http://nasa.tumblr.com.